Optic disc and cup segmentation
A two-stage U-Net that outlines the optic disc and cup in a photo of the eye and measures the cup-to-disc ratio. The outlines are close to the specialist's; the ratio underestimates large cups, the end that matters for glaucoma. A research demo, not a medical tool.A model that outlines two parts of the eye in a photo and measures the ratio specialists check for glaucoma. The outlines come out close to the specialist's, but the ratio comes out too low for large cups, the cases that matter most. A research demo, not a medical tool.
01/06 · 0:00The ratio
Specialists compare the height of the pale cup with the disc around it. A higher ratio is more suspicious for glaucoma: a clue, not a diagnosis.
The problem
The optic disc is where the optic nerve leaves the eye: a bright patch in a fundus photo. The cup is the paler pit in its centre. In glaucoma the nerve is damaged and the cup grows, so specialists compare their heights. A higher vertical cup-to-disc ratio is more suspicious: a clue, not a diagnosis.The optic disc is the bright spot where the nerve leaves the eye; the cup is the paler pit in its middle. In glaucoma the nerve is damaged and the cup grows, so specialists compare the cup's height with the disc's. A higher ratio is more suspicious: a clue, not a diagnosis.
The aim was to turn the photo into that number by labelling every pixel as disc, cup or neither, then to find out where it goes wrong.I wanted to turn the photo into that number by labelling every pixel as disc, cup or neither, and then find out where it goes wrong.
How it works
Two stages, because the disc covers about 1.6% of the photo: one network on the whole image would see the cup as a few pixels. A locator U-Net finds the disc; a segmenter U-Net then outlines disc and cup in a square crop around it.The disc covers less than 2% of the photo, so one model on the whole image would see the cup as a few pixels. The first model only finds the disc; the second looks at a close-up crop around it, where the disc and cup are large.
The loss adds soft Dice to cross-entropy, because cross-entropy alone can score well by predicting “no cup” everywhere. Both networks use a pretrained ResNet34 encoder and trained in about 11 minutes on a laptop.I trained it to reward overlap with the specialist's outline, because a model scored only pixel by pixel can look good by never predicting a cup at all. Both models trained in about 11 minutes on a laptop.
What I found
The outlines are strong. The ratio beats a constant guess, but not by a wide margin, and the chart shows why: predictions are pulled toward the middle, too high for small cups and too low for large ones, the end that matters for glaucoma.The outlines match the specialist's closely. The ratio beats always guessing the typical value, but not by much, and the chart shows why: it reads small cups too high and large cups too low, and large cups are the ones that matter for glaucoma.
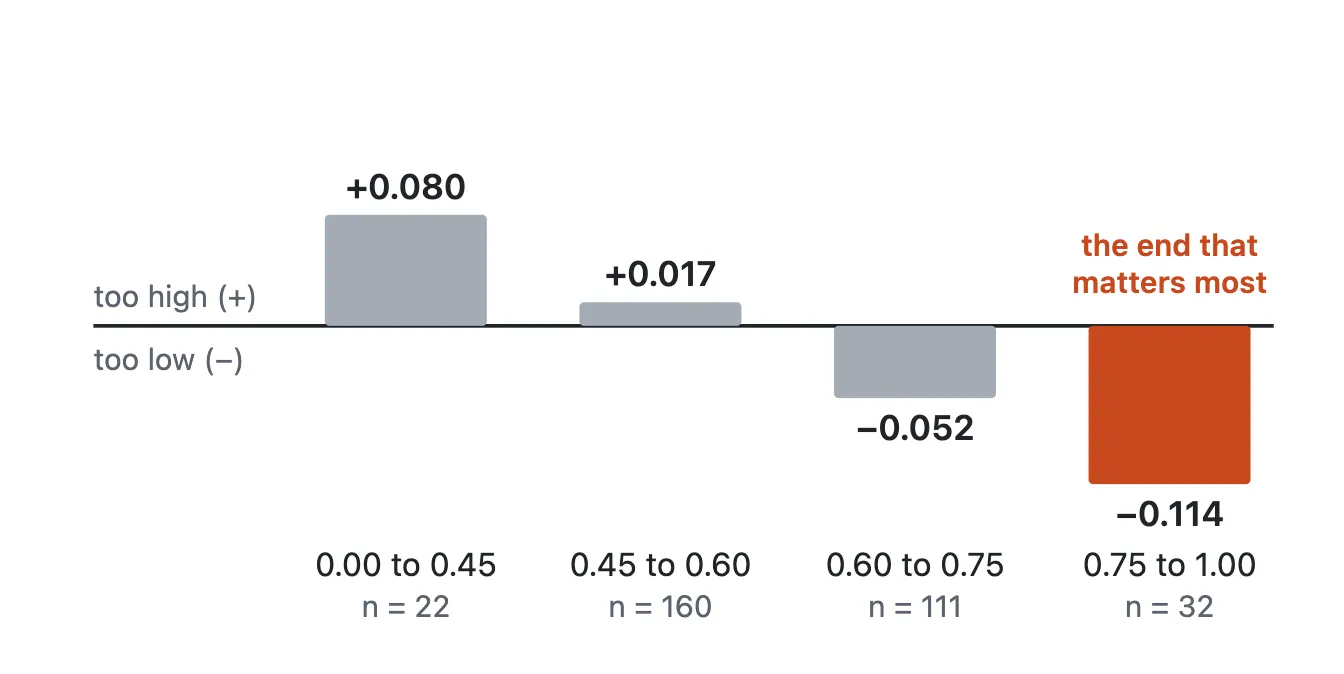
On the same ORIGA split, its ratio error (0.063) is in the same range as the published M-Net result (0.071, Fu et al., 2018). The pipelines and preprocessing differ, so this says the result is plausible; it doesn't rank the two.Its ratio error is in the same range as a published 2018 method tested on the same split of the same photos. The two were built differently, so this says the result is plausible; it doesn't say which is better.
Limits
275 training photos from one dataset. How it does on other cameras and populations is unmeasured; there is no external test set.It learned from 275 photos from one source. How it does on other cameras and people is unknown, and there's no outside test set.
The data has no patient IDs, so one person's two eyes may fall on both sides of the split. The masks come from a semi-automatic tool and are smooth ellipses, which are easier to match than hand-drawn outlines.The dataset has no patient IDs, so both eyes of one person may sit on both sides of the train/test split. And the specialist outlines are smooth ovals from a semi-automatic tool, which are easier to match than hand-drawn ones.
The results come from a single training run, so run-to-run variation is unmeasured.The results come from one training run, so I haven't measured how much they vary between runs.
Stack
 PythonPyTorchU-Net, ResNet34Gradio
 Docker
© 2026 Syed Muhammad Hassan Raza